Dev Tools
Overview
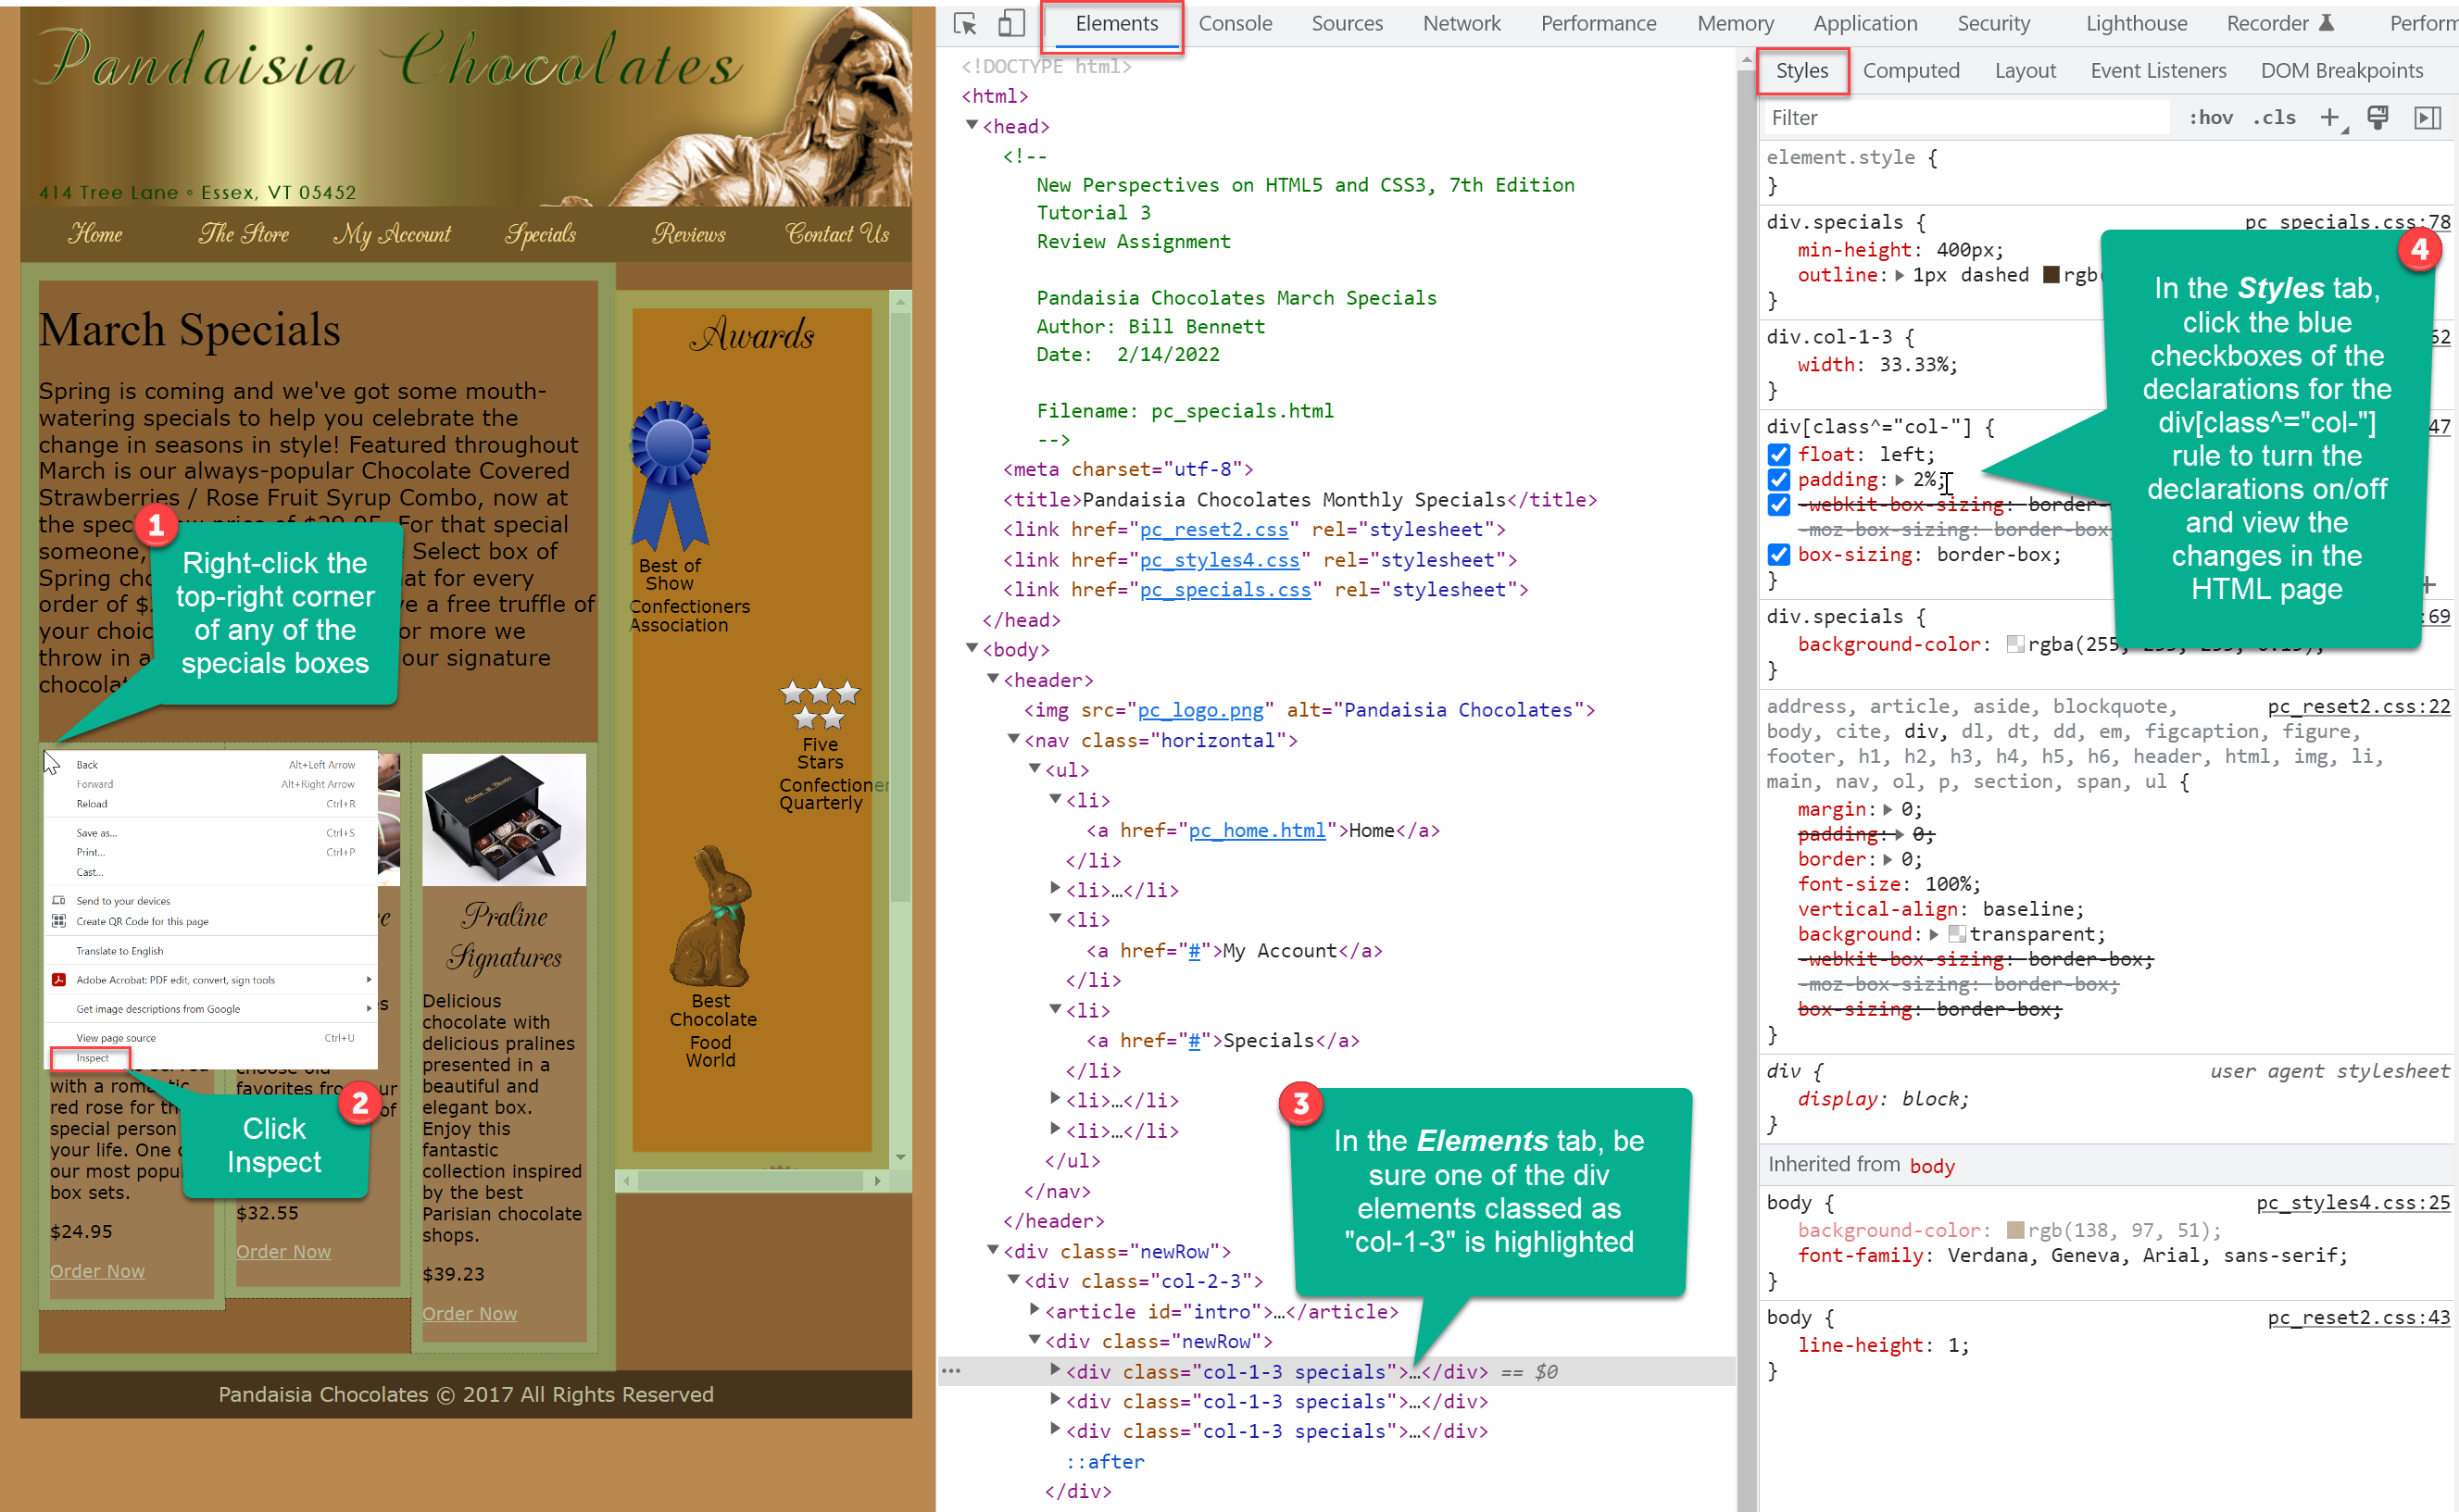
Web browsers have built-in developer's tools which help Web developers to debug HTML pages and Web applications. To access your Web browser's dev tools you have a couple of options. One way is to press the F12 key on your keyboard when your Web browser is the active application on your computer. Another way is to right-click on an element in a Web page and clicking or tapping "Inspect" on the context menu that appears.
 This info graphic provides steps for viewing a Web page using a browser's built-in developer tools. Click or tap the image for a larger view.
Dev Tool's Features
- Elements: the Elements tab let's you inspect HTML elements and explore how CSS styles are being applied to them, including identifying the CSS rules, declarations, and style sheet files and line numbers.
- Console: the Console tab is used to troubleshoot JavaScript issues.
- Sources: the Sources tab let's developers see the supporting files used by the Web page.
- Network: lists the components of the Web page and how long it takes it to be retrieved and loaded by the Web browser.
- Performance: lets you record activity in the runtime performance of a page in the Web browser. Here is a tutorial to help you use this tab - https://developer.chrome.com/docs/devtools/performance/.
- Memory: identifies how much memory each resource is using.
- Application: Identifies statistics about numerous components that make up a Web application.
- Security: Provides an overview of a Web pages security.
- Lighthouse: Helps you optimize the speed of your Web pages.
Links of Interest